Estimating age, gender, and emotions
In this tutorial you'll learn how to estimate age, gender, and emotions of a face using Face SDK. The result will be displayed next to the detected face. This tutorial expects that you already have a project with face detection in a video stream or on an image. You can learn how to detect faces in a video stream in the [Face Detection and Tracking in a Video Stream] tutorial (/tutorials/face_detection_and_tracking_in_a_video_stream). In this tutorial we estimate age, gender, and emotions on the image.
You can find the tutorial project in Face SDK: examples/tutorials/age_gender_and_emotions

Estimate gender and age
- Specify the path to the image in the
QImage imagefield. Set the parameters of labels with information about gender, age, and emotions (text size and style).
main.cpp
QImage image(image_path);
    QPainter painter(&image);
    QPen pen;
    pen.setWidth(2);
    painter.setPen(pen);
    painter.setFont(QFont("Arial", 15, QFont::DemiBold));
- Set the
margin_from_rectindent between the face bounding rectangle and the text with information about a face. Set the distance between the elements "age group", "age", and "emotion"text_element_position. These elements are displayed to the right of a detected face, one below the other.
main.cpp
    const int margin_from_rect = 32; // margin text from face bounding rect
    const int text_element_position = 32;
- Use the
pbio::FacerecService::createAgeGenderEstimatormethod to create theAgeGenderEstimatorobject and estimate gender and age. When you call this method, specify theage_gender_estimator.xmlconfiguration file.
main.cpp
// create the age-gender estimator
pbio::AgeGenderEstimator::Ptr age_gender_estimator = service->createAgeGenderEstimator("age_gender_estimator.xml");
- Calculate the
base_pointstarting point to display the information about gender, age, and emotions: get the face bounding rectangle from theRawSampleobject, which stores the face information and calculate the point, taking into account themargin_from_rectindent.
main.cpp
// calculate the base point to draw age, gender and emotion information
const pbio::RawSample::Rectangle rectangle = sample->getRectangle();
const QPoint base_point = QPoint(rectangle.x + rectangle.width + margin_from_rect, rectangle.y);
- Estimate gender and age of a face
(*sample)using thepbio::AgeGenderEstimatormethod. Display the age group based on the estimated age. Four age groups are available:
- Kid (under 18 years)
- Young (18-37 years)
- Adult (37-55 years)
- Senior (55 years and older)
The age group is taken from the pbio::AgeGenderEstimator::Age enumeration and the result is stored in the age_group_text variable. Display the label with the age group using the painter.drawText method. The label will be on the first line to the right of the base_point starting point.
main.cpp
// estimate and draw age and gender
{
    const pbio::AgeGenderEstimator::AgeGender age_gender = age_gender_estimator->estimateAgeGender(*sample);

    painter.save();

    // draw age group
    const QMap<pbio::AgeGenderEstimator::Age, QString> age_map =
    {
                    {pbio::AgeGenderEstimator::AGE_KID,    "Kid"},
                    {pbio::AgeGenderEstimator::AGE_YOUNG,  "Young"},
                    {pbio::AgeGenderEstimator::AGE_ADULT,  "Adult"},
                    {pbio::AgeGenderEstimator::AGE_SENIOR, "Senior"}
    };
    QString age_group_text = QString("Age Group: %1").arg(age_map[age_gender.age]);

    painter.drawText(base_point + QPoint(0, text_element_position * 0), age_group_text);
}
- Display the age in years on the second line (under the age group).
main.cpp
// estimate and draw age and gender
{
     ...
    // draw age in years
    QString age_in_years_text = QString("Age: %1").arg((int)age_gender.age_years);
    painter.drawText(base_point + QPoint(0, text_element_position * 1), age_in_years_text);
}
- Display the gender on the third line (under the age).
main.cpp
// estimate and draw age and gender
{
    ...
    // draw gender
    QString gender = age_gender.gender == pbio::AgeGenderEstimator::GENDER_MALE ? "Male" : "Female";
    QString gender_text = QString("Gender: %1").arg(gender);
    painter.drawText(base_point + QPoint(0, text_element_position * 2), gender_text);

    painter.restore();
}
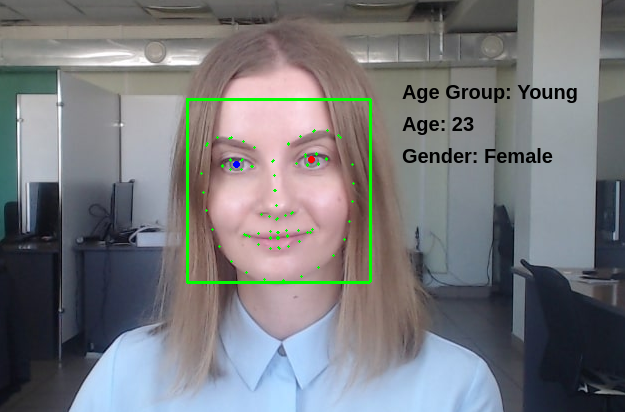
- Run the project. You'll see the information about the age group, age and gender to the right of the detected face.
Estimating emotions
- Use the
pbio::FacerecService::createEmotionsEstimatormethod to create theEmotionsEstimatorobject and estimate emotions. When you call this method, specify theemotions_estimator.xmlconfiguration file.
main.cpp
// create the emotions estimator
pbio::EmotionsEstimator::Ptr emotions_estimator = service->createEmotionsEstimator("emotions_estimator.xml");
- Use the
pbio::EmotionsEstimator::estimateEmotionsmethod to estimate emotions of a detected face(*sample)and get a confidence coefficient (from 0 to 1). Thepbio::EmotionsEstimator::Emotionenumeration includes all available emotions. Face SDK estimates four emotions:
- Neutral
- Happy
- Angry
- Surprised
Each emotion is assigned an index from 0 to 3. In this project we display emotions as four columns of different colors (blue, green, red, yellow) with corresponding labels (Neutral, Happy, Angry, Surprised). If the confidence coefficient of emotion is high, then the column for this emotion is longer than three other columns. This clearly shows which emotion prevails. All parameters of emotions are stored in the emotions_params dictionary.
main.cpp
// estimate and draw emotions
{
    // estimate emotions for a sample
    const std::vector<pbio::EmotionsEstimator::EmotionConfidence> emotions =    emotions_estimator->estimateEmotions(*sample);

    // emotion parameters for drawing: row number, bar color, label text
    struct EmotionParams
    {
        int row;
        QColor color;
        QString label;
    };

    const QMap<pbio::EmotionsEstimator::Emotion, EmotionParams> emotions_params =
    {
            {pbio::EmotionsEstimator::EMOTION_NEUTRAL, {0, Qt::blue, "Neutral"}},
            {pbio::EmotionsEstimator::EMOTION_HAPPY, {1, Qt::green, "Happy"}},
            {pbio::EmotionsEstimator::EMOTION_ANGRY, {2, Qt::red, "Angry"}},
            {pbio::EmotionsEstimator::EMOTION_SURPRISE, {3, Qt::yellow, "Surprise"}}
    };
}
- Set the
emotions_base_pointstarting point which you will use to draw the columns with emotions (to the right of a face bounding rectangle with the labels). Also set the size of the columns with emotionsbar_base_sizeandbar_offsetindent from the labels of emotions.
main.cpp
// estimate and draw emotions
{
    ...
    const QPoint emotions_base_point(base_point + QPoint(0, text_element_position * 3)); // base point of first emotion
    const QSizeF bar_base_size(100, 15); // base size for emotion confidence bar
    const QPoint bar_offset(100, 0); // offset of emotion bar from emotion label
}
- Display the labels and columns. In the loop calculate the
emotion_row_base_pointstarting point to display the information about each emotion and thetext_base_pointstarting point to display the emotion name. Then, get the emotion name from the dictionary and display theemotion_labellabel. Display the column for each emotion: calculate the starting point to display thebar_base_pointcolumn and calculate the length of thebar_sizecolumn. To do this, multiply the value ofbar_base_size.widthby the confidence coefficient. Color the columns according to the colors from the dictionary.
main.cpp
// estimate and draw emotions
{
    ...
    // iterate by emotions
    for (const auto &emotion_confidence: emotions)
    {
        const auto &emotion_params = emotions_params[emotion_confidence.emotion];

        const int &emotion_row = emotion_params.row;
        const QPoint emotion_row_base_point = emotions_base_point + QPoint(0,   text_element_position * emotion_row);
        const QPoint text_base_point = emotion_row_base_point + QPoint(0, bar_base_size.height());

        painter.save();

        // draw an emotion label
        const QString &emotion_label = emotion_params.label;
        painter.drawText(text_base_point, emotion_label);

        // draw a confidence bar
        const QPoint bar_base_point = emotion_row_base_point + bar_offset;
        QSizeF bar_size(bar_base_size.width() * emotion_confidence.confidence, bar_base_size.height());
        const QColor &emotion_color = emotion_params.color;

        pen.setColor(emotion_color);
        pen.setWidth(1);
        painter.setPen(pen);
        painter.setBrush(QBrush(emotion_color));
        painter.drawRect(QRectF(bar_base_point, bar_size));

        painter.restore();
    }
}
- Run the project. To the right of the face bounding rectangle, you'll see the information about emotions (the length of a column visualizes the probability distribution in the space of described emotions).