Crowd Analytics
With OMNI Platform you can track the number of unique, new and returning visitors over time, as well as get the information about their age, gender and emotions. The system receives the data from your cameras in real time to count visitors and determine their demographics, visiting statistics and emotions.
Depending on the number and demographics of your visitors within different time periods you can capture your audience trends and change commodity groups to boost sales and increase conversion. Besides, the visualized estimation of the prevailing emotional state of your visitors will help you to measure the effectiveness of marketing campaigns and customer satisfaction.
For your convenience all analytics is visualized in the analytics dashboards. To view the analytics dashboard, open web interface home page and choose Crowd Analytics at the Analytics panel.
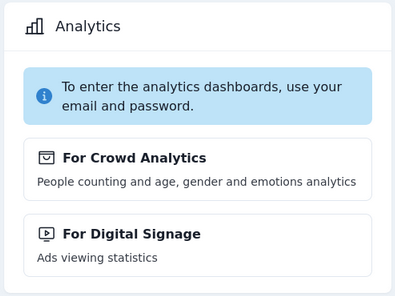
Crowd Analytics Dashboard
The analytics dashboard for Crowd Analytics consists of 4 sections:
- Audience Counting
- Audience Demographics
- Audience Visiting Statistics
- Audience Emotions
For your convenience all collected analytics is represented in the charts and highlighted with different colors. To view visitors' number and percentage for each analytics parameter, just point the mouse cursor to the chart area of your interest.
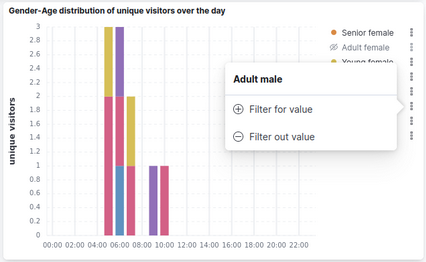
All charts are equipped with a smart legend, allowing you to customize their appearance if necessary, deactivating the display of certain parameters.
To deactivate the parameters, choose the necessary parameter in the smart legend and click on the 3 dots icon on the right. In the pop-up window select Filter out value option and the parameter will be deactivated. To deactivate the parameter in vertical bar charts, you can just click on the certain parameter in the smart legend and it will disappear from the chart.
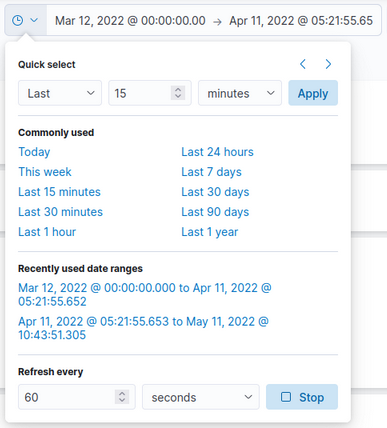
In the analytics dashboard you can view the analytics for a specified time period. To select the time period, click on the clock icon in the top right corner of your dashboard.
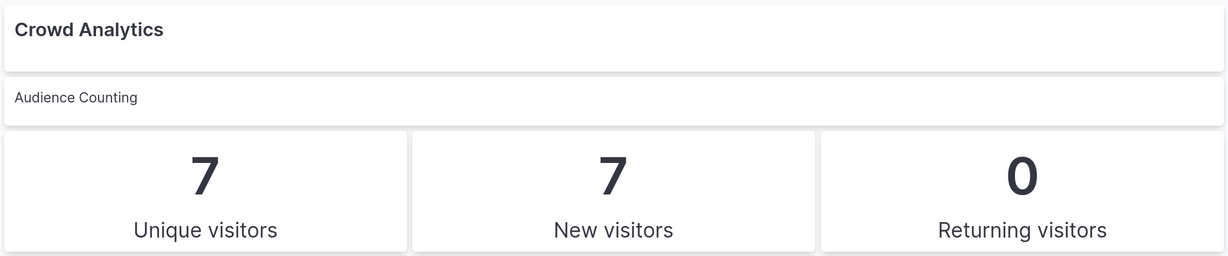
Audience Counting
This section shows the number of unique, new and returning visitors detected in the field of view of your camera in real time.
- Unique visitor is a person, once detected by OMNI Agent.
- New visitor is a person, detected by OMNI Agent for the first time.
- Returning visitor is a person, repeatedly detected by OMNI Agent.
Audience Demographics
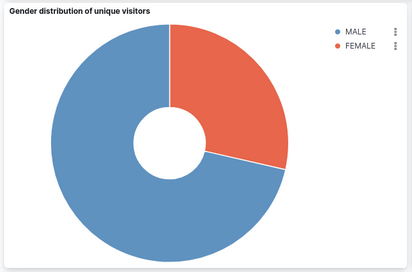
The charts in this section show gender, age and gender-age distribution of unique visitors over the specified time period.
Gender distribution chart shows the number and percentage of male and female unique visitors.
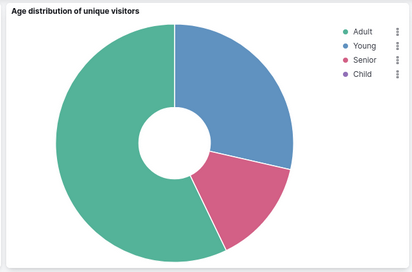
Age distribution chart shows the number and percentage of unique visitors by age groups:
- child (under 14 inclusive)
- young (from 14 to 25 inclusive)
- adult (from 25 to 45 inclusive)
- senior (from 45 to 100 inclusive)
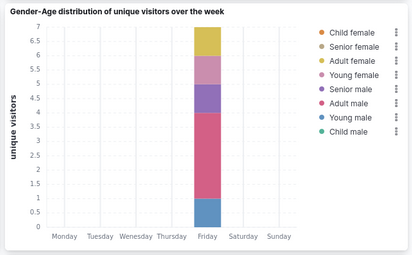
Gender-Age distribution chart shows the number and percentage of unique visitors by demographic groups:
- child male
- child female
- young male
- young female
- adult male
- adult female
- senior male
- senior female

Audience Visiting Statistics
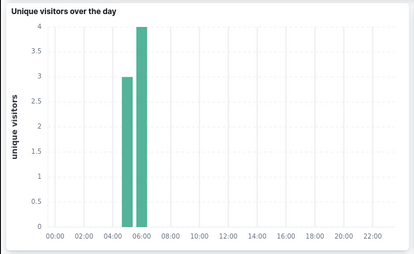
This section displays aggregate traffic data for different time periods. For each time period the system builds separate charts showing the number of unique visitors, the number of new and returning visitors and gender-age distribution. Based on the data presented, you can make a conclusion at what time the most intensive human traffic occurs.
Unique visitors over the day chart shows the hours of day allocation of the number of unique visitors for the specified time period.
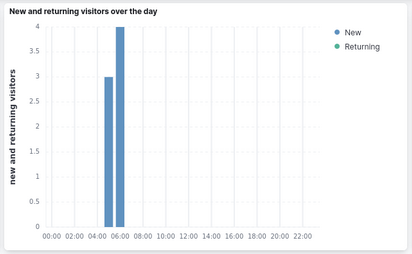
New and returning visitors over the day chart shows the hours of day allocation of the number of new and returning visitors for the specified time period.
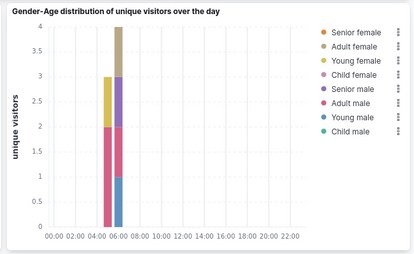
Gender-Age distribution of unique visitors over the day chart shows the hours of day distribution by demographic groups for the specified time period.
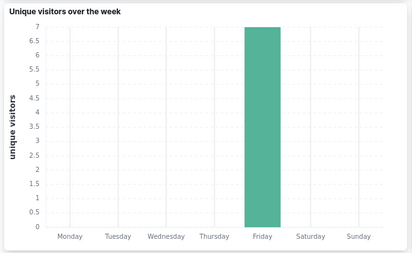
Unique visitors over the week chart shows the day-by-week allocation of the number of unique visitors for the specified time period.
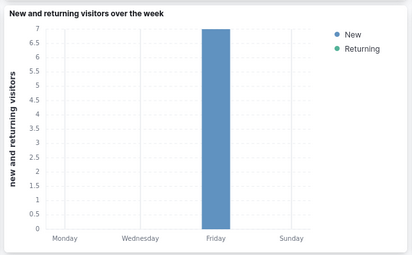
New and returning visitors over the week chart shows the day-by-week allocation of the number of new and returning visitors for the specified time period.
Gender-Age distribution of unique visitors over the week chart shows the day-by-week distribution by demographic groups for the specified time period.
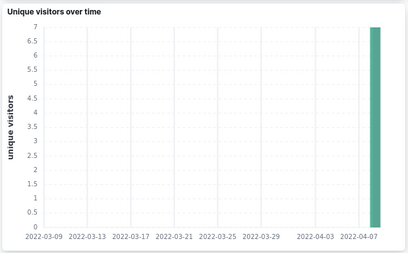
Unique visitors over time chart shows the over time allocation of the number of unique visitors for the specified time period.
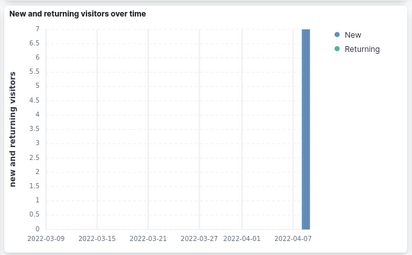
New and returning visitors over time chart shows the over time allocation of the number of new and returning visitors for the specified time period.
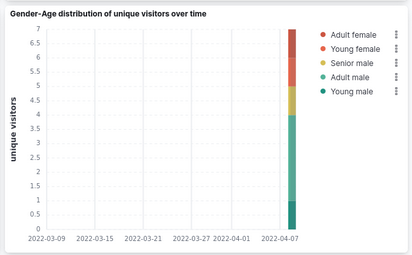
Gender-Age distribution of unique visitors over time chart shows the over time distribution by demographic groups for the specified time period.
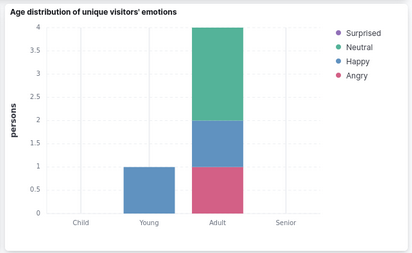
Audience Emotions
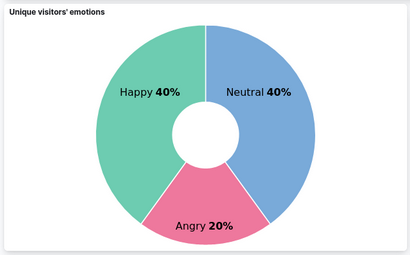
The charts in this section display the emotional state of your audience: happy, surprised, neutral or angry. This analytics can be used to measure the effectiveness of your marketing campaigns and customer satisfaction.
Unique visitors' emotions chart provides you with distribution of different emotional states of your audience detected over the selected time period.
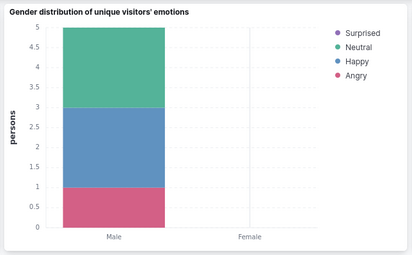
Gender distribution of unique visitors' emotions chart provides you with distribution of different emotional states of male and female visitors detected over the selected time period.
Age distribution of unique visitors' emotions chart provides you with distribution of different emotional states by age groups detected over the selected time period.